

On average 9.5 million tonnes of food is wasted every year in the UK. A lot of this waste is due to supermarkets and restaurants throwing away food they can’t sell.
But what about household waste…
How much food do you throw away in a week? After examining last year’s food waste data, we found the council areas with the most and least waste collection.
According to government waste data, 847,000 tonnes of household food waste was collected in 2020-21. The average collected by local authority was 7,058 tonnes.
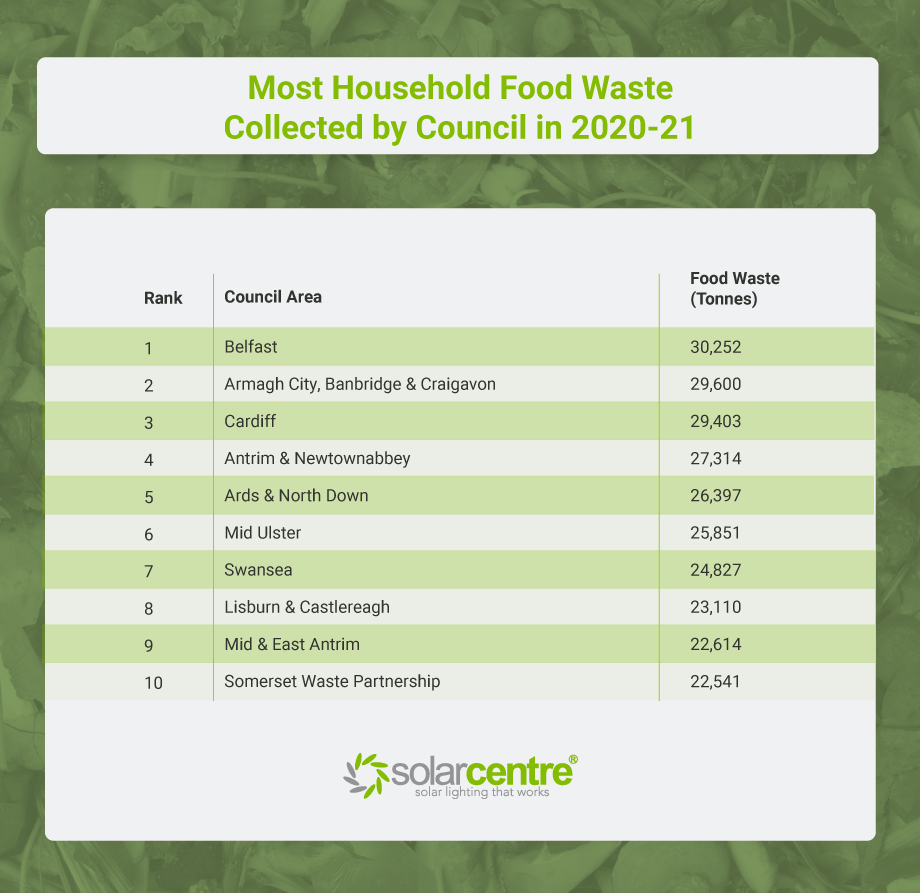
Belfast City Council collected the most household food waste last year with 30,252 tonnes – over four times the average.
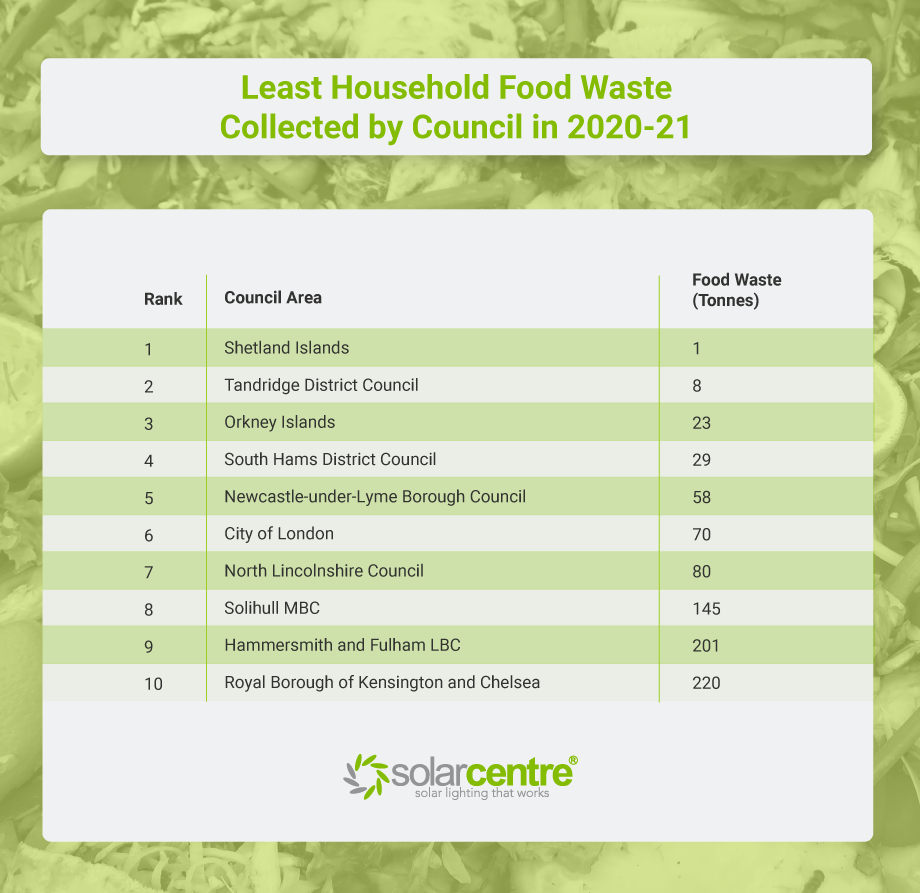
At the other end of the spectrum, Shetland Islands only reported one tonne of household food waste collected in 2019 (latest data available), which is under 1kg per person.
Scotland’s local authorities saw their recycling rates fall over the last couple of years. With Scottish government pointed to the closure of recycling centres during lockdown restrictions having a major impact.
Now let’s look at what this food waste equates to per person. If we account for population, these are the areas with the most food waste per person –
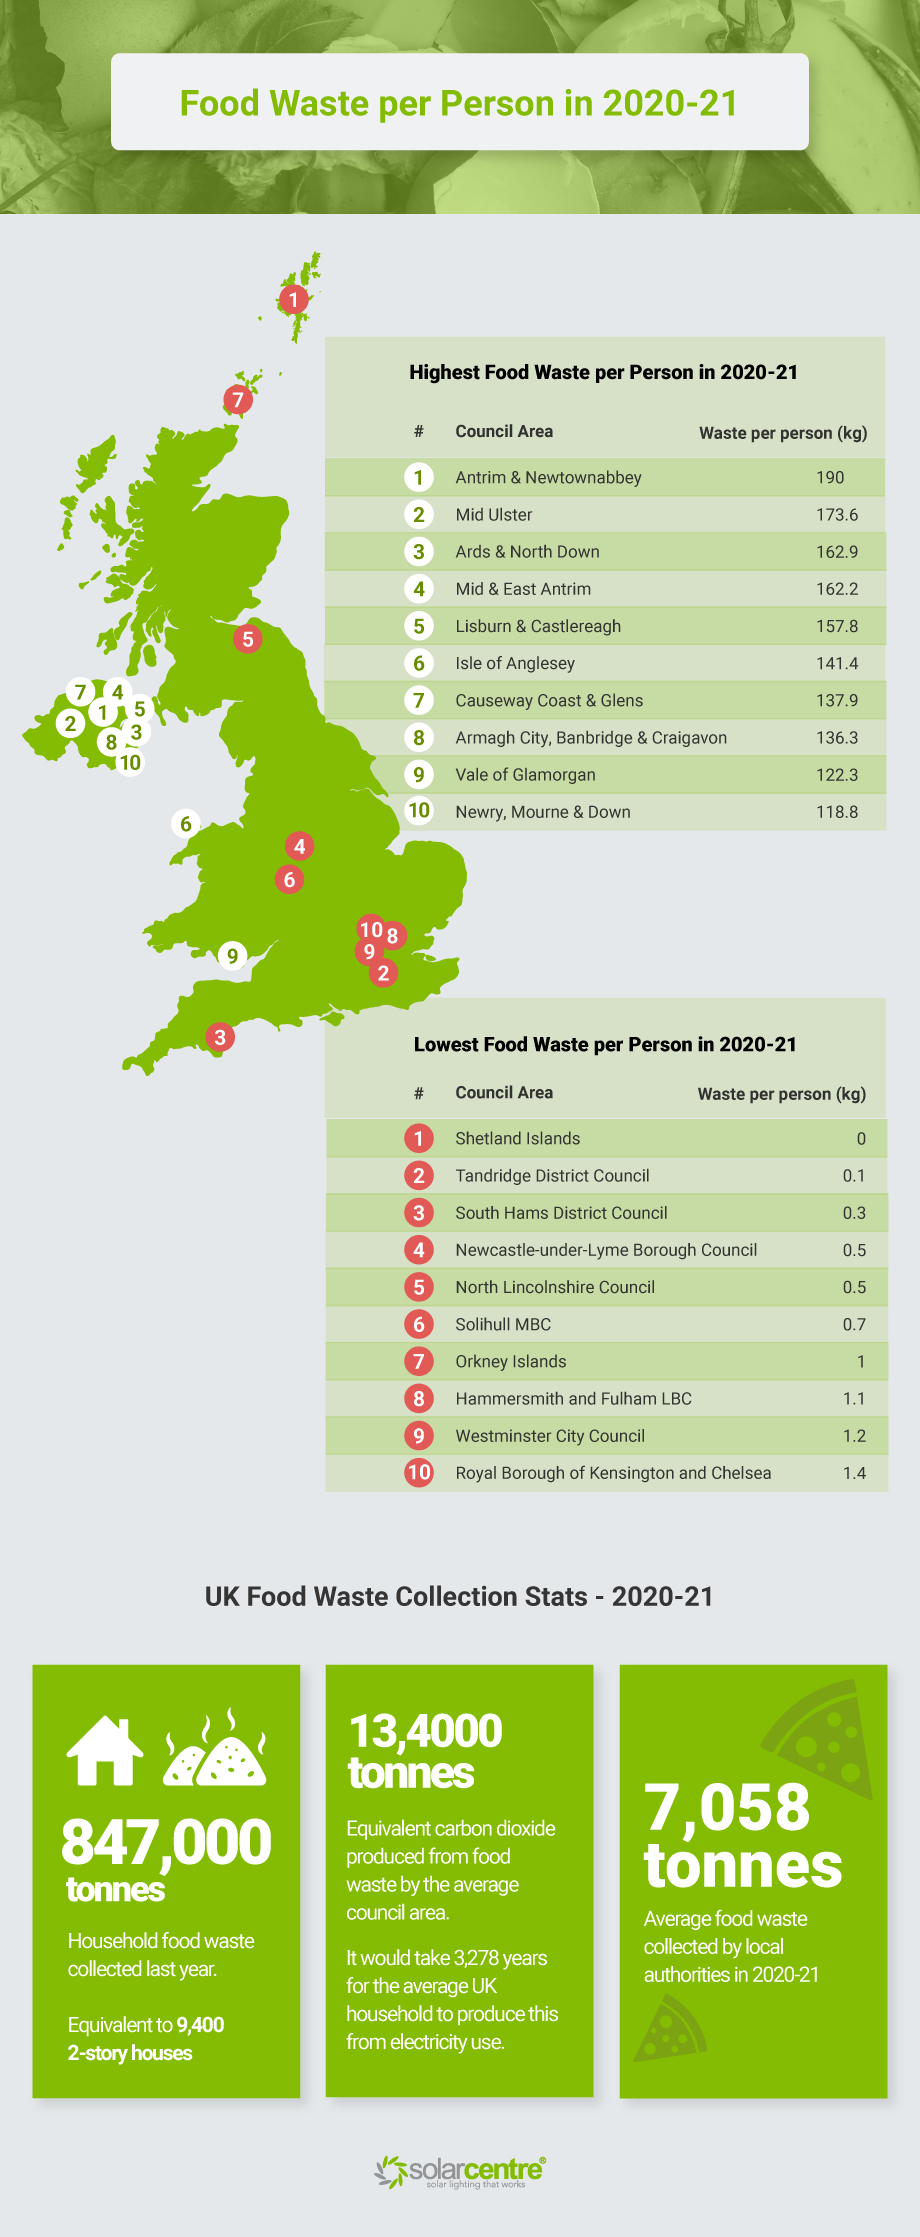
Of course, this doesn’t necessarily mean these are the areas wasting the most food. Some areas might have more food waste that isn’t collected for whatever reason (people discarding food in with general waste, different councils dealing with food collection for different areas, among other reasons).
But it does give us a rough idea of how much food is wasted per person in the UK. The average in 2020-21 was 44kg and several areas fell well above or below this average.
Environmental Impact
There are wider environmental concerns with food waste. When food ends up in landfill it breaks down, producing carbon dioxide and methane emissions. The real problem is the methane produced by food waste – a gas 25 times more potent than CO2.
Using this formula, we can see how greenhouse gases from food waste compare to everyday household electricity consumption – https://watchmywaste.com.au/food-waste-greenhouse-gas-calculator/.
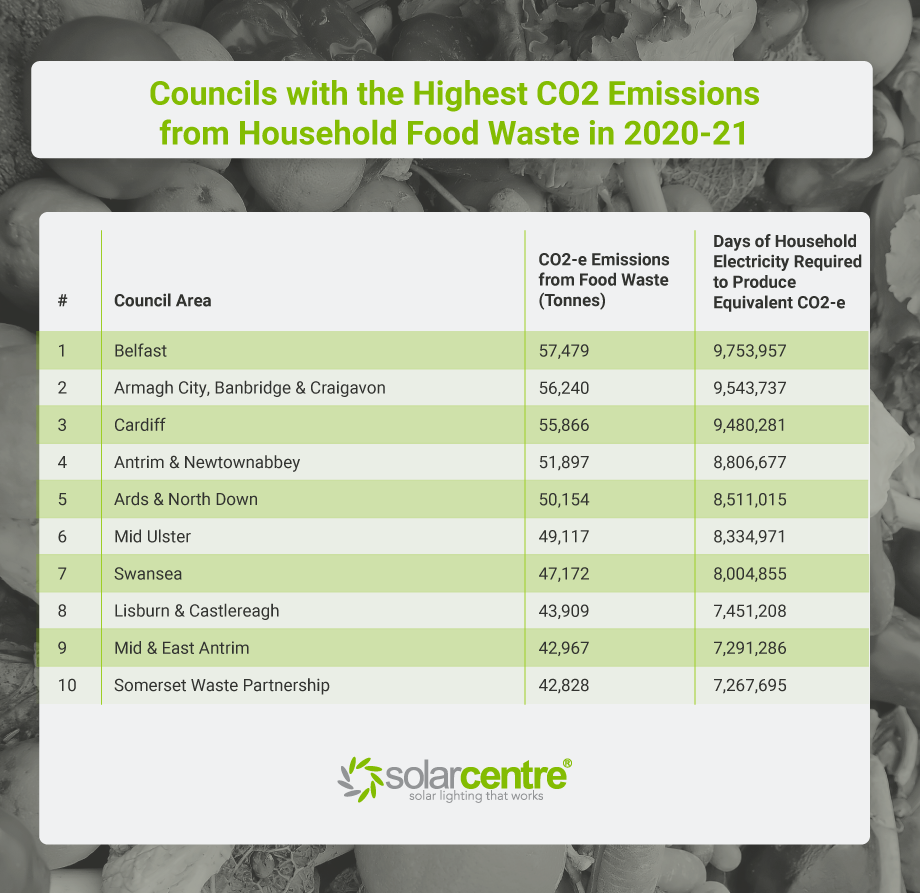
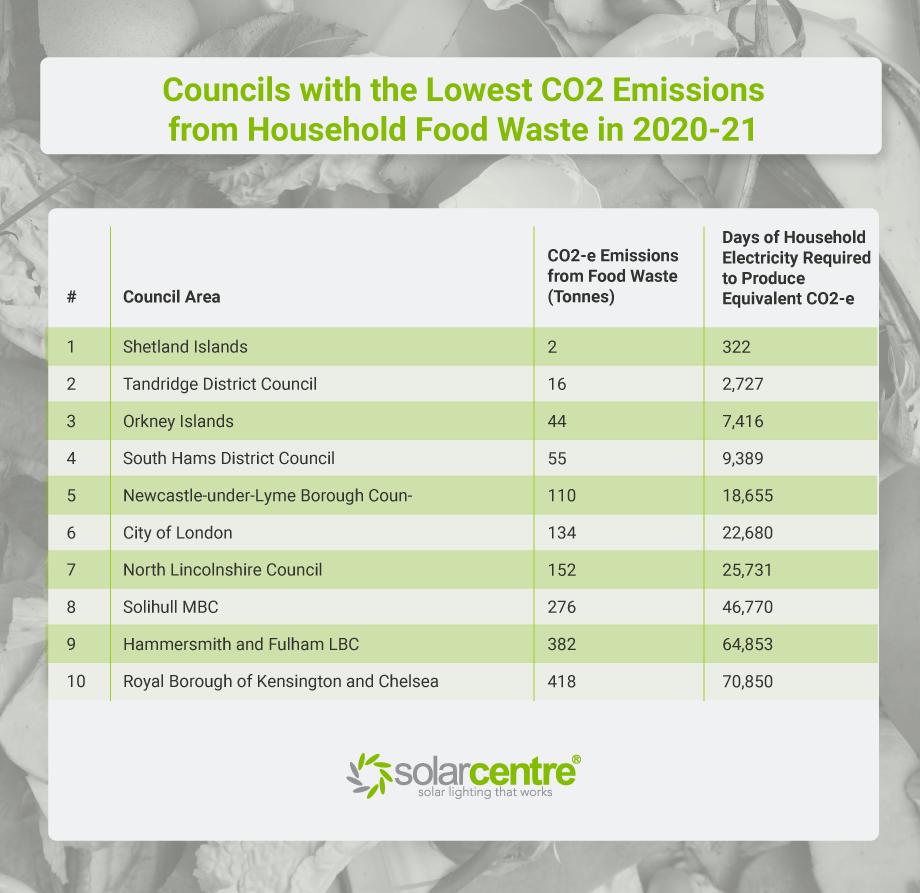
On average council areas produced 13.4 thousand tonnes of potential CO2-e (carbon dioxide equivalent from greenhouse gases) from food waste in 2020-21. This is the same CO2-e produced from 2.3 million days of electricity consumption in an average household.
Many councils deal with food waste in different ways – much of our food waste is recycled or incinerated for clean energy. So keep in mind that this is the potential carbon emissions from collected food waste (calculations assume it was all sent to rot in landfill). Emissions will vary from council to council, depending on how they deal with their food waste.
Note – Carbon dioxide equivalent (CO2-e) is a metric for measuring how greenhouse gases affect global warming, relative to carbon dioxide.
Find your area by exploring our full dataset here. (Please right-click column header to filter results)
Methodology
The Solar Centre compiled food waste collection data reported by Local Authority Waste Management in England, Scotland, Northern Ireland and Wales. The population of each council is based on estimates provided by the Office of National Statistics.
We were only able to report on data from councils who submitted figures for household food waste. Please note – several councils have no reported data for household food waste collection in 2020-21.
The average food waste collected per person was calculated by taking the total mass (Tonnes) collected and divided by the population from the councils that provided waste collection data.
Sources:
- England waste collection data – data.gov.uk/dataset/waste
- Wales waste collection data – statswales.gov.wales/Waste
- Northern Ireland waste collection data – www.daera-ni.gov.uk/waste
- Scotland waste collection data – statistics.gov.scot/household-wastedata (latest data available – 2019)
- Food waste – CO2-e formula – watchmywaste.com.au/calculator/
- Population – ons.gov.uk/datasets/populationestimates
- Weight of a house – whatthingsweigh.com/
- Weight of an elephant – en.wikipedia.org/wiki/Elephant#Size
- Food waste stats – www.businesswaste.co.uk/food-waste-2022-the-facts/