DO YOU LIVE IN AN AREA THAT’S
RUBBISH AT RECYCLING?
We’ve merged key government datasets to find out which areas are the best and worst at recycling. We’ve also compared the recycling rates to the population of millennials and political party – so how does your area stack up?
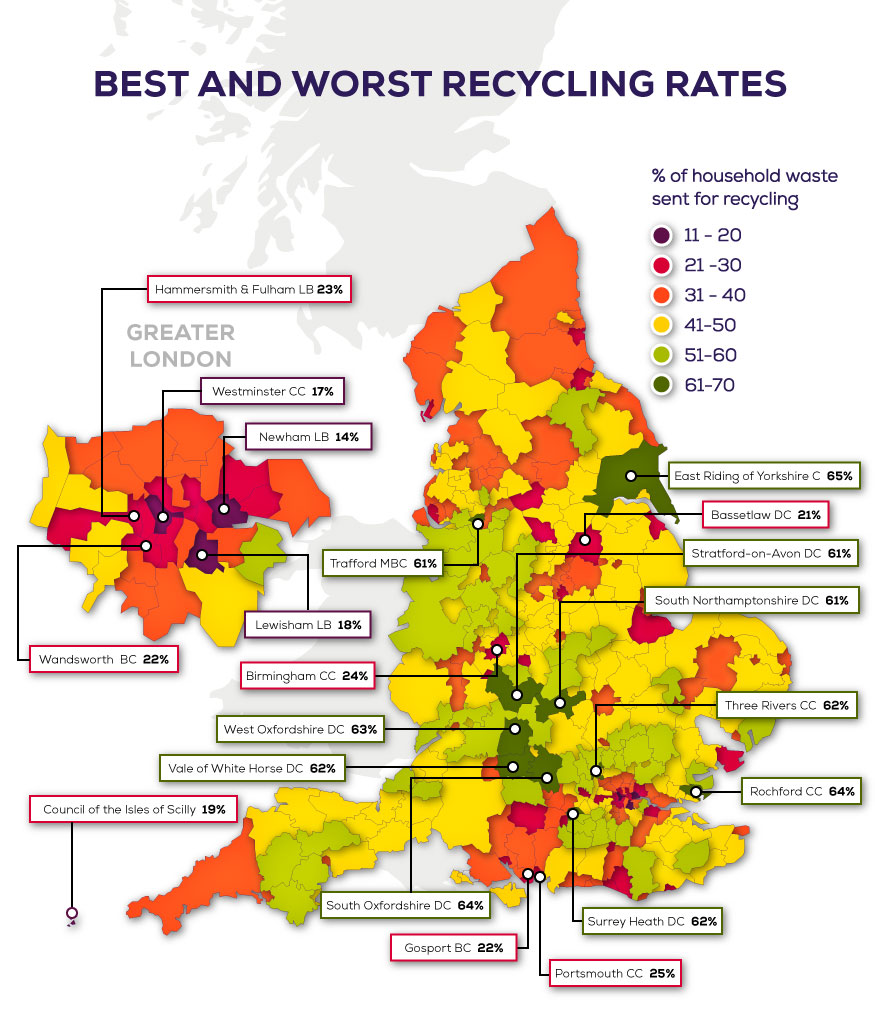
LOCAL AUTHORITIES WITH THE HIGHTEST AND LOWEST RECYCLING RATES IN EACH REGION
2016/2017
| Region | Lowest Recycling Rate | Highest Recycling Rate | Regional Average |
|---|---|---|---|
| London | Newham LB |
Bexley LB |
33% |
| North East | Stockton-on-Tees BC |
Redcar & Cleveland BC |
36% |
| West Midlands | Birmingham CC |
Stratford-on-Avon DC |
41% |
| Yorkshire & Humber | North East Lincolnshire C |
East Riding of Yorkshire C |
43% |
| South East | Gosport BC |
South Oxfordshire DC |
46% |
| East Midlands | Bassetlaw DC |
South Northamptonshire DC |
46% |
| North West | Liverpool CC |
Trafford MBC |
46% |
| South West | The Isles of Scilly C |
Cotswold DC |
48% |
| Eastern | Tendring DC |
Rochford DC |
49% |
BC = Borough Council, CC = City Council, DC = District Council, LB = London Borough, MBC = Metropolitan Borough Council
www.thesolarcentre.co.uk
Source for Recycling Rates: Department for Environment Food & Rural Affairs
Household waste sent for recycling includes organic recycling following mechanical biological treatment
Source for Millennial Population and political control: Office of National Statistics (2016)
Millenials population born between 1981 – 1997